
Setting up Xdebug for local debugging can streamline your development workflow and improve the quality of your code. With Xdebug, you can step through your code line by line, examine variables, and set breakpoints to pause execution at specific points. By following the steps outlined in this article, you can get started with Xdebug and start debugging your PHP applications more efficiently. Whether you're a seasoned developer or just starting out, Xdebug is an essential tool that can help you write better code and reduce the time spent on debugging.
Introduction to Xdebug
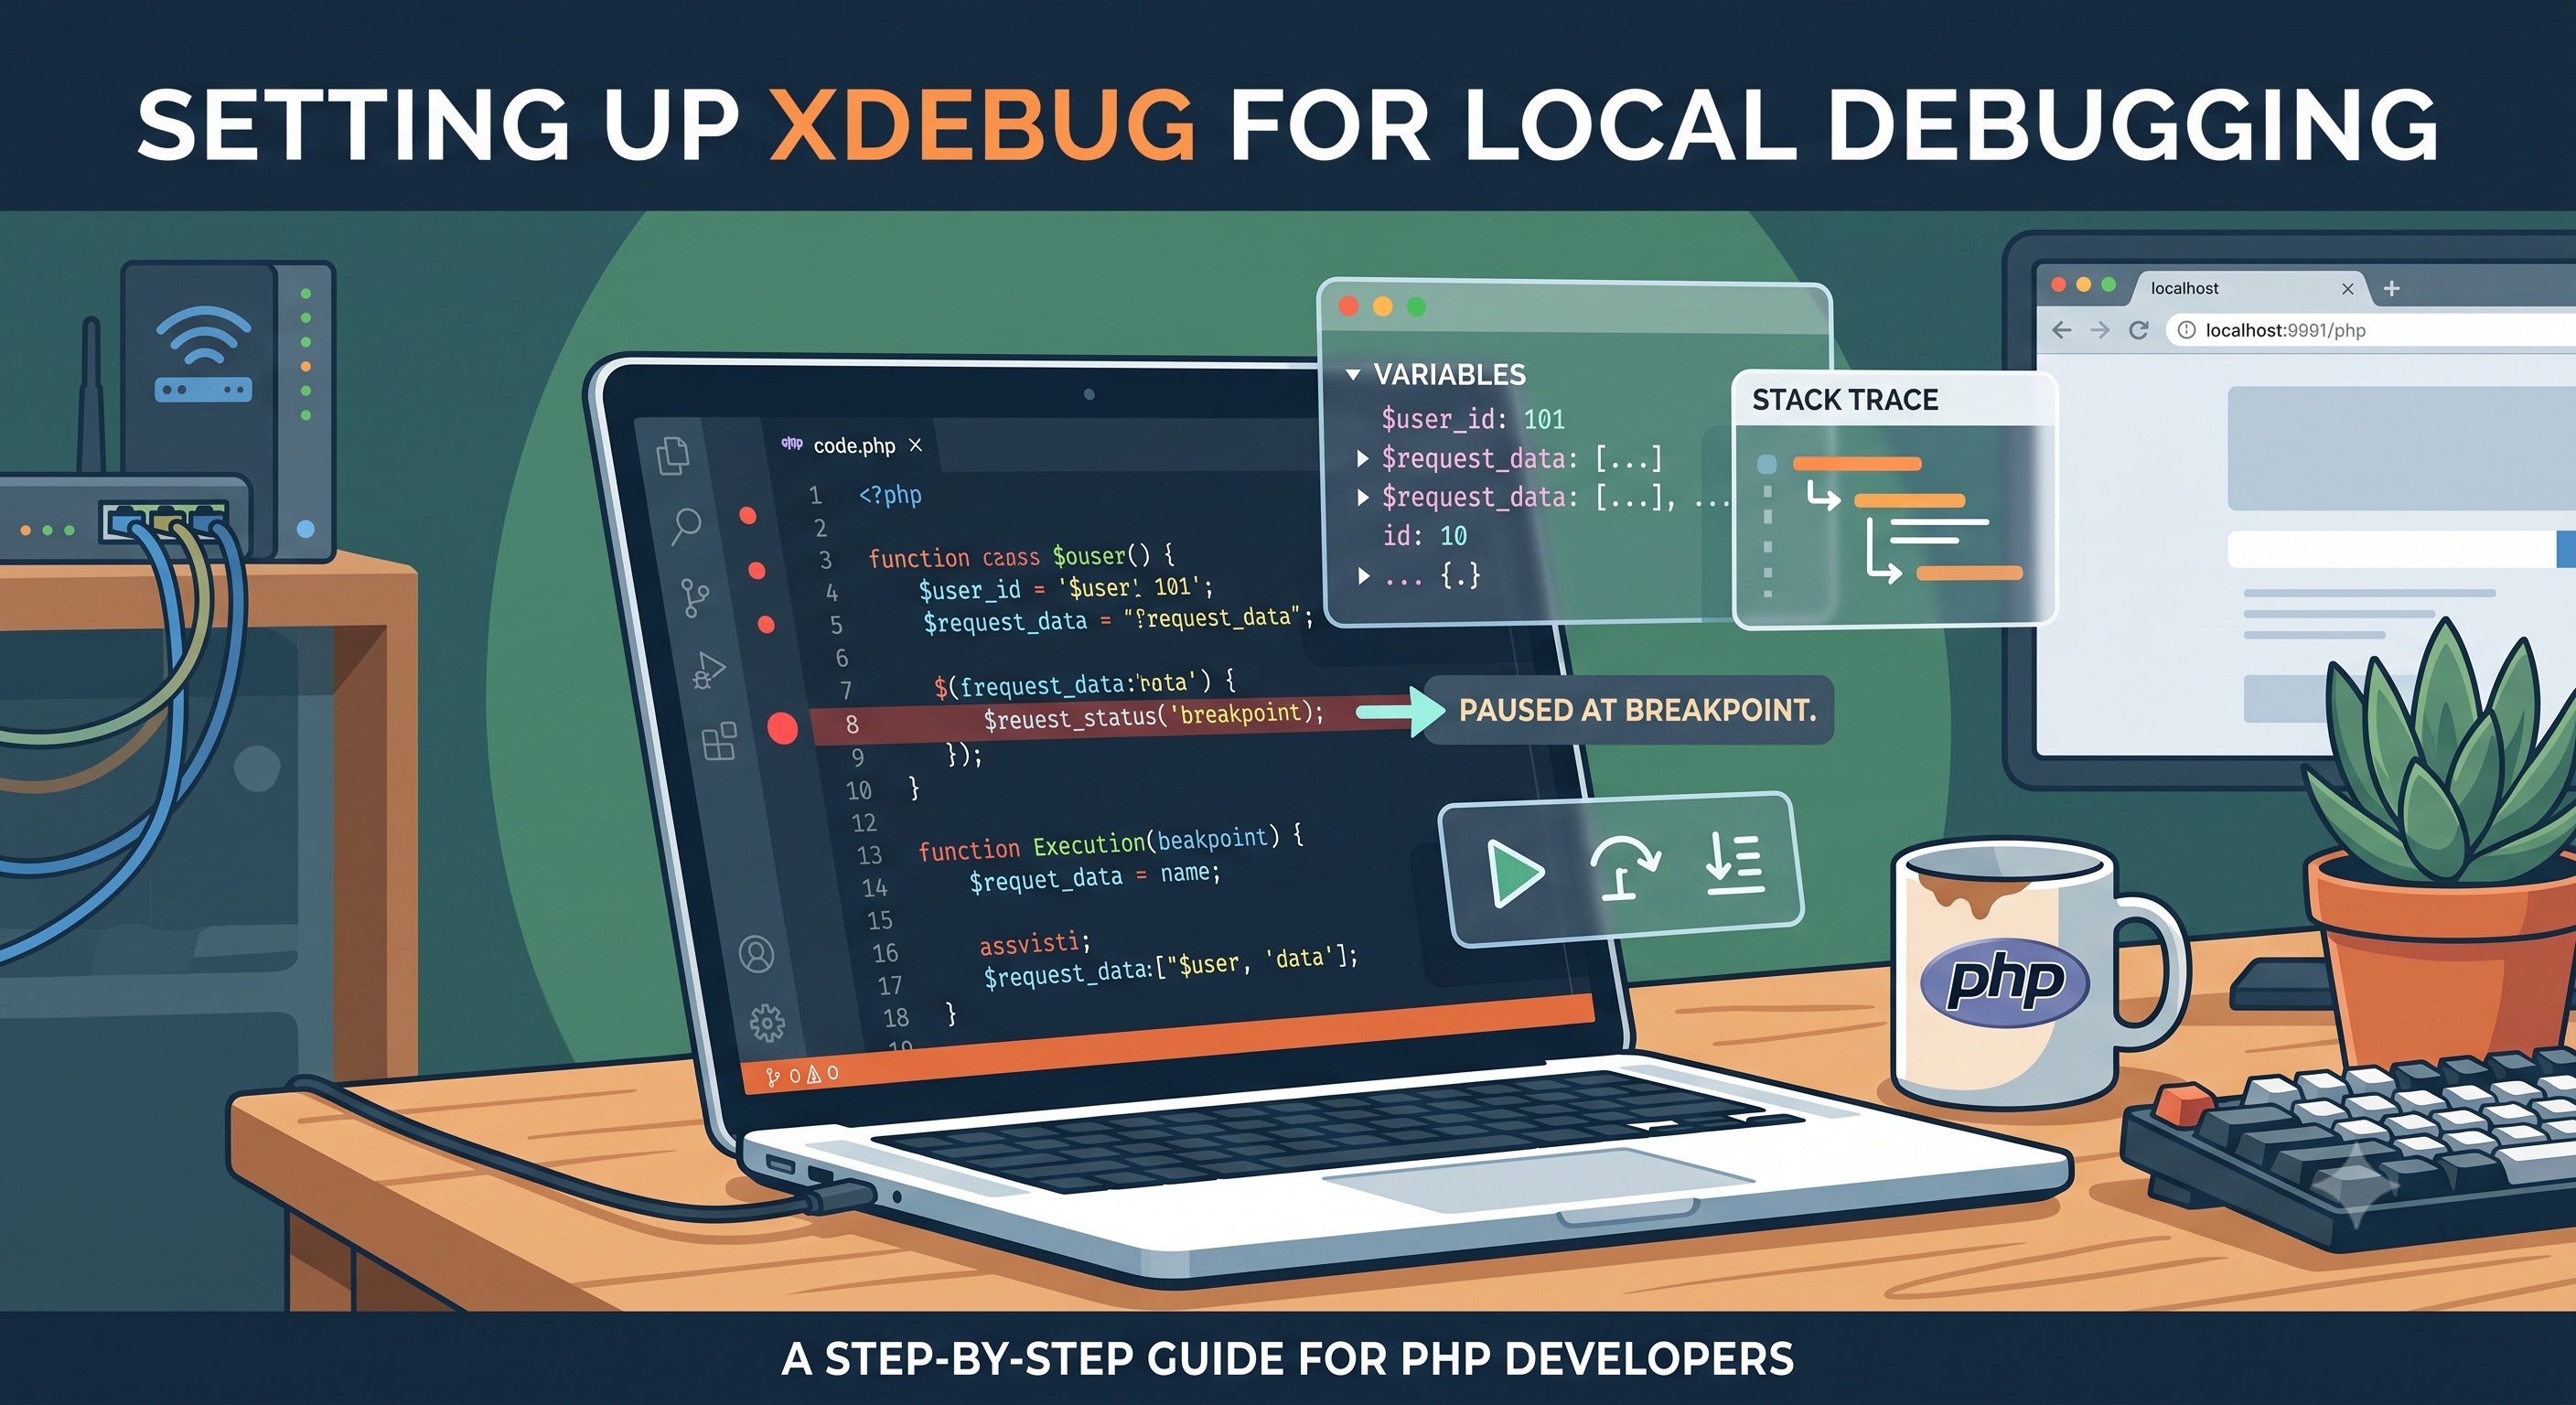
Xdebug is a powerful debugging tool for PHP that provides detailed information about the execution of your scripts, allowing you to identify and fix errors more efficiently. With Xdebug, you can step through your code line by line, examine variables, and set breakpoints to pause execution at specific points. In this article, we will guide you through the process of setting up Xdebug for local debugging, helping you to streamline your development workflow and improve the quality of your code.
Why Use Xdebug for Local Debugging?
Before we dive into the setup process, let's discuss the benefits of using Xdebug for local debugging. Xdebug offers several advantages over traditional debugging methods, such as using `var_dump()` or `print_r()` statements. Some of the key benefits include:
- Step-through debugging: Xdebug allows you to step through your code line by line, examining the values of variables and the state of your application at each point.
- Breakpoints: You can set breakpoints to pause execution at specific points in your code, making it easier to inspect the state of your application.
- Variable inspection: Xdebug provides detailed information about the variables in your application, including their values, data types, and scope.
- Error handling: Xdebug can help you identify and fix errors more efficiently by providing detailed information about the execution of your scripts.
Installing Xdebug
To get started with Xdebug, you need to install it on your local development environment. The installation process varies depending on your operating system and PHP version. Here are the general steps:
Installing Xdebug on Linux
To install Xdebug on Linux, you can use the following command:
```bash
sudo apt-get install php-xdebug
```
This will install the Xdebug extension for PHP. Once installed, you need to configure Xdebug by adding the following lines to your `php.ini` file:
```ini
zend_extension=/usr/lib/php/20190902/xdebug.so
xdebug.remote_enable=1
xdebug.remote_autostart=1
```
Installing Xdebug on Windows
To install Xdebug on Windows, you can download the pre-compiled binaries from the Xdebug website. Once downloaded, you need to copy the `php_xdebug.dll` file to your PHP extension directory. You also need to configure Xdebug by adding the following lines to your `php.ini` file:
```ini
zend_extension=C:\Path\To\php_xdebug.dll
xdebug.remote_enable=1
xdebug.remote_autostart=1
```
Installing Xdebug on macOS
To install Xdebug on macOS, you can use Homebrew to install the Xdebug extension. Here's how:
```bash
brew install php-xdebug
```
This will install the Xdebug extension for PHP. Once installed, you need to configure Xdebug by adding the following lines to your `php.ini` file:
```ini
zend_extension=/usr/local/Cellar/php/7.4.3/lib/php/20190902/xdebug.so
xdebug.remote_enable=1
xdebug.remote_autostart=1
```
Configuring Your IDE
Once Xdebug is installed and configured, you need to configure your Integrated Development Environment (IDE) to work with Xdebug. The configuration process varies depending on your IDE, but here are the general steps:
Configuring PHPStorm
To configure PHPStorm, follow these steps:
1. Open the Settings dialog box by pressing `Ctrl + Shift + Alt + S` (Windows/Linux) or `Cmd + Shift + Alt + S` (macOS).
2. In the Settings dialog box, navigate to Languages & Frameworks > PHP.
3. Click on the Debug tab.
4. Select Xdebug as the debugger.
5. Enter the port number that Xdebug is listening on (usually `9003`).
Configuring Visual Studio Code
To configure Visual Studio Code, follow these steps:
1. Open the Command Palette by pressing `Ctrl + Shift + P` (Windows/Linux) or `Cmd + Shift + P` (macOS).
2. Type "PHP: Select Debugger" and select Xdebug.
3. Open the Settings dialog box by pressing `Ctrl + Shift + P` (Windows/Linux) or `Cmd + Shift + P` (macOS).
4. Type "PHP: Debug Port" and enter the port number that Xdebug is listening on (usually `9003`).
Using Xdebug for Local Debugging
Now that Xdebug is installed and configured, you can start using it for local debugging. Here's how:
1. Set a breakpoint in your code by clicking on the line number where you want to pause execution.
2. Start the debugger by clicking on the Debug button or pressing `F9`.
3. Xdebug will pause execution at the breakpoint, allowing you to inspect the state of your application.
4. You can step through your code line by line, examine variables, and set additional breakpoints as needed.
Troubleshooting Common Issues
Here are some common issues that you may encounter when setting up Xdebug for local debugging:
- Xdebug not starting: Make sure that Xdebug is installed and configured correctly. Check the `php.ini` file to ensure that the Xdebug extension is enabled.
- Breakpoints not working: Make sure that the breakpoint is set correctly and that the debugger is started.
- Xdebug not connecting to IDE: Make sure that the port number is correct and that the IDE is configured to listen on the correct port.
Conclusion
Setting up Xdebug for local debugging can streamline your development workflow and improve the quality of your code. With Xdebug, you can step through your code line by line, examine variables, and set breakpoints to pause execution at specific points. By following the steps outlined in this article, you can get started with Xdebug and start debugging your PHP applications more efficiently. Whether you're a seasoned developer or just starting out, Xdebug is an essential tool that can help you write better code and reduce the time spent on debugging.