
The browser DevTools have revolutionized the way developers debug, test, and optimize their web applications. These powerful tools provide a wide range of features that can help developers identify and fix issues quickly, improving the overall quality and performance of their applications. In this article, we will explore some tips and tricks for using browser DevTools effectively, helping you to get the most out of these powerful tools.
Introduction to Browser DevTools
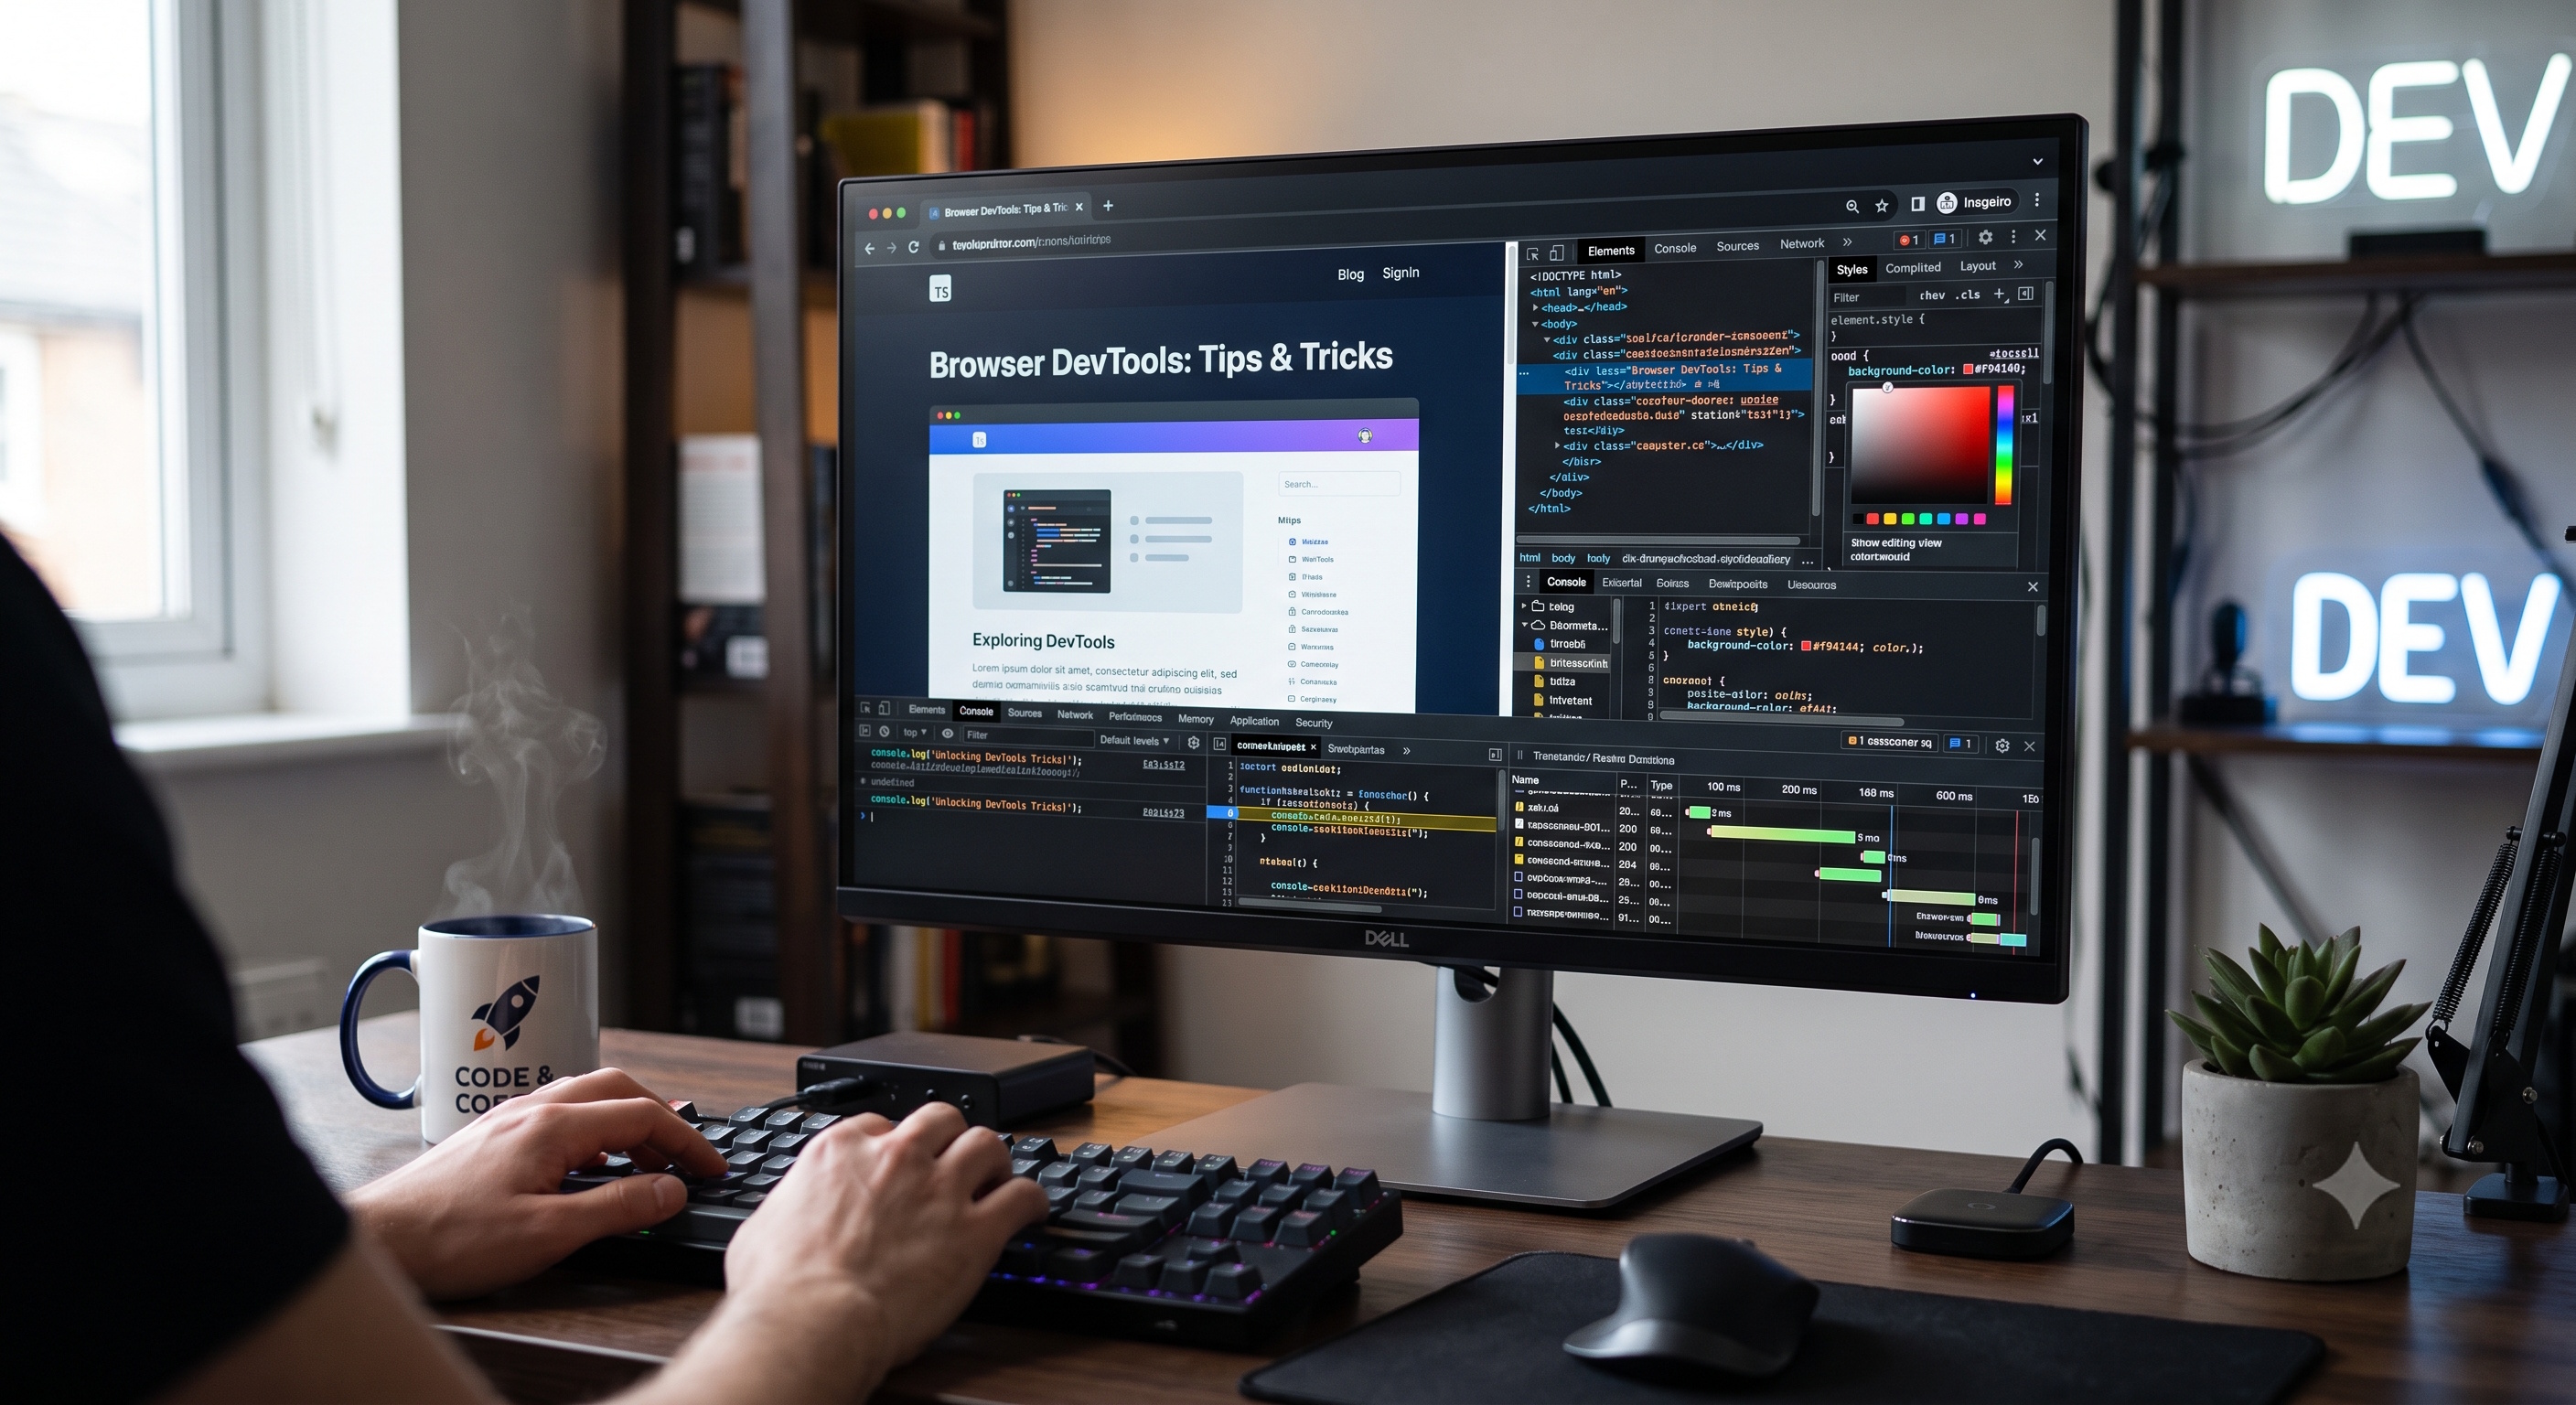
Browser DevTools are a set of web developer tools built into most modern web browsers. They provide a wide range of features, including debugging tools, performance analysis, and optimization techniques. The most popular browser DevTools are Chrome DevTools, Firefox Developer Edition, and Microsoft Edge DevTools. Each of these tools has its own unique features and strengths, but they all share the common goal of helping developers build better web applications.
Key Features of Browser DevTools
Some of the key features of browser DevTools include:
- Elements Panel: allows developers to inspect and modify the HTML and CSS of a web page
- Console Panel: provides a JavaScript console for executing code and viewing error messages
- Sources Panel: allows developers to view and edit the source code of a web page
- Network Panel: provides information about network requests and responses
- Performance Panel: provides information about the performance of a web page, including load times and frame rates
Tips for Using Browser DevTools
Here are some tips for using browser DevTools effectively:
- Use the Elements Panel to Inspect and Modify HTML and CSS: the Elements Panel is one of the most powerful features of browser DevTools. It allows developers to inspect and modify the HTML and CSS of a web page, making it easy to identify and fix issues with the layout and styling of a page.
- Use the Console Panel to Debug JavaScript: the Console Panel is a powerful tool for debugging JavaScript code. It provides a JavaScript console for executing code and viewing error messages, making it easy to identify and fix issues with JavaScript code.
- Use the Sources Panel to View and Edit Source Code: the Sources Panel provides a powerful way to view and edit the source code of a web page. It allows developers to set breakpoints, inspect variables, and step through code, making it easy to identify and fix issues with JavaScript code.
- Use the Network Panel to Analyze Network Requests: the Network Panel provides a powerful way to analyze network requests and responses. It allows developers to view information about network requests, including request and response headers, response bodies, and timing information.
Advanced Tips and Tricks
Here are some advanced tips and tricks for using browser DevTools:
- Use the Performance Panel to Optimize Performance: the Performance Panel provides a powerful way to optimize the performance of a web page. It allows developers to view information about the performance of a page, including load times, frame rates, and CPU usage.
- Use the Audits Panel to Identify Best Practices: the Audits Panel provides a powerful way to identify best practices for a web page. It allows developers to run audits on a page, providing recommendations for improving performance, accessibility, and security.
- Use the Lighthouse Panel to Run Automated Audits: the Lighthouse Panel provides a powerful way to run automated audits on a web page. It allows developers to run audits on a page, providing recommendations for improving performance, accessibility, and security.
- Use the Browser DevTools Extensions: browser DevTools extensions provide a powerful way to extend the functionality of browser DevTools. They allow developers to add new features and tools to browser DevTools, making it easy to customize the tools to meet their needs.
Best Practices for Using Browser DevTools
Here are some best practices for using browser DevTools:
- Use Browser DevTools Regularly: browser DevTools should be used regularly to identify and fix issues with a web application. This helps to ensure that the application is running smoothly and efficiently.
- Use Browser DevTools to Test and Debug Code: browser DevTools should be used to test and debug code, rather than relying on manual testing and debugging techniques.
- Use Browser DevTools to Optimize Performance: browser DevTools should be used to optimize the performance of a web application, rather than relying on manual optimization techniques.
- Use Browser DevTools to Identify Security Issues: browser DevTools should be used to identify security issues with a web application, rather than relying on manual security testing techniques.
Conclusion
Browser DevTools are a powerful set of tools that can help developers build better web applications. By using browser DevTools effectively, developers can identify and fix issues quickly, improve the performance and security of their applications, and ensure that their applications are running smoothly and efficiently. In this article, we have explored some tips and tricks for using browser DevTools, including how to use the Elements Panel, Console Panel, Sources Panel, Network Panel, and Performance Panel. We have also explored some advanced tips and tricks, including how to use the Audits Panel, Lighthouse Panel, and browser DevTools extensions. By following the best practices outlined in this article, developers can get the most out of browser DevTools and build better web applications.