

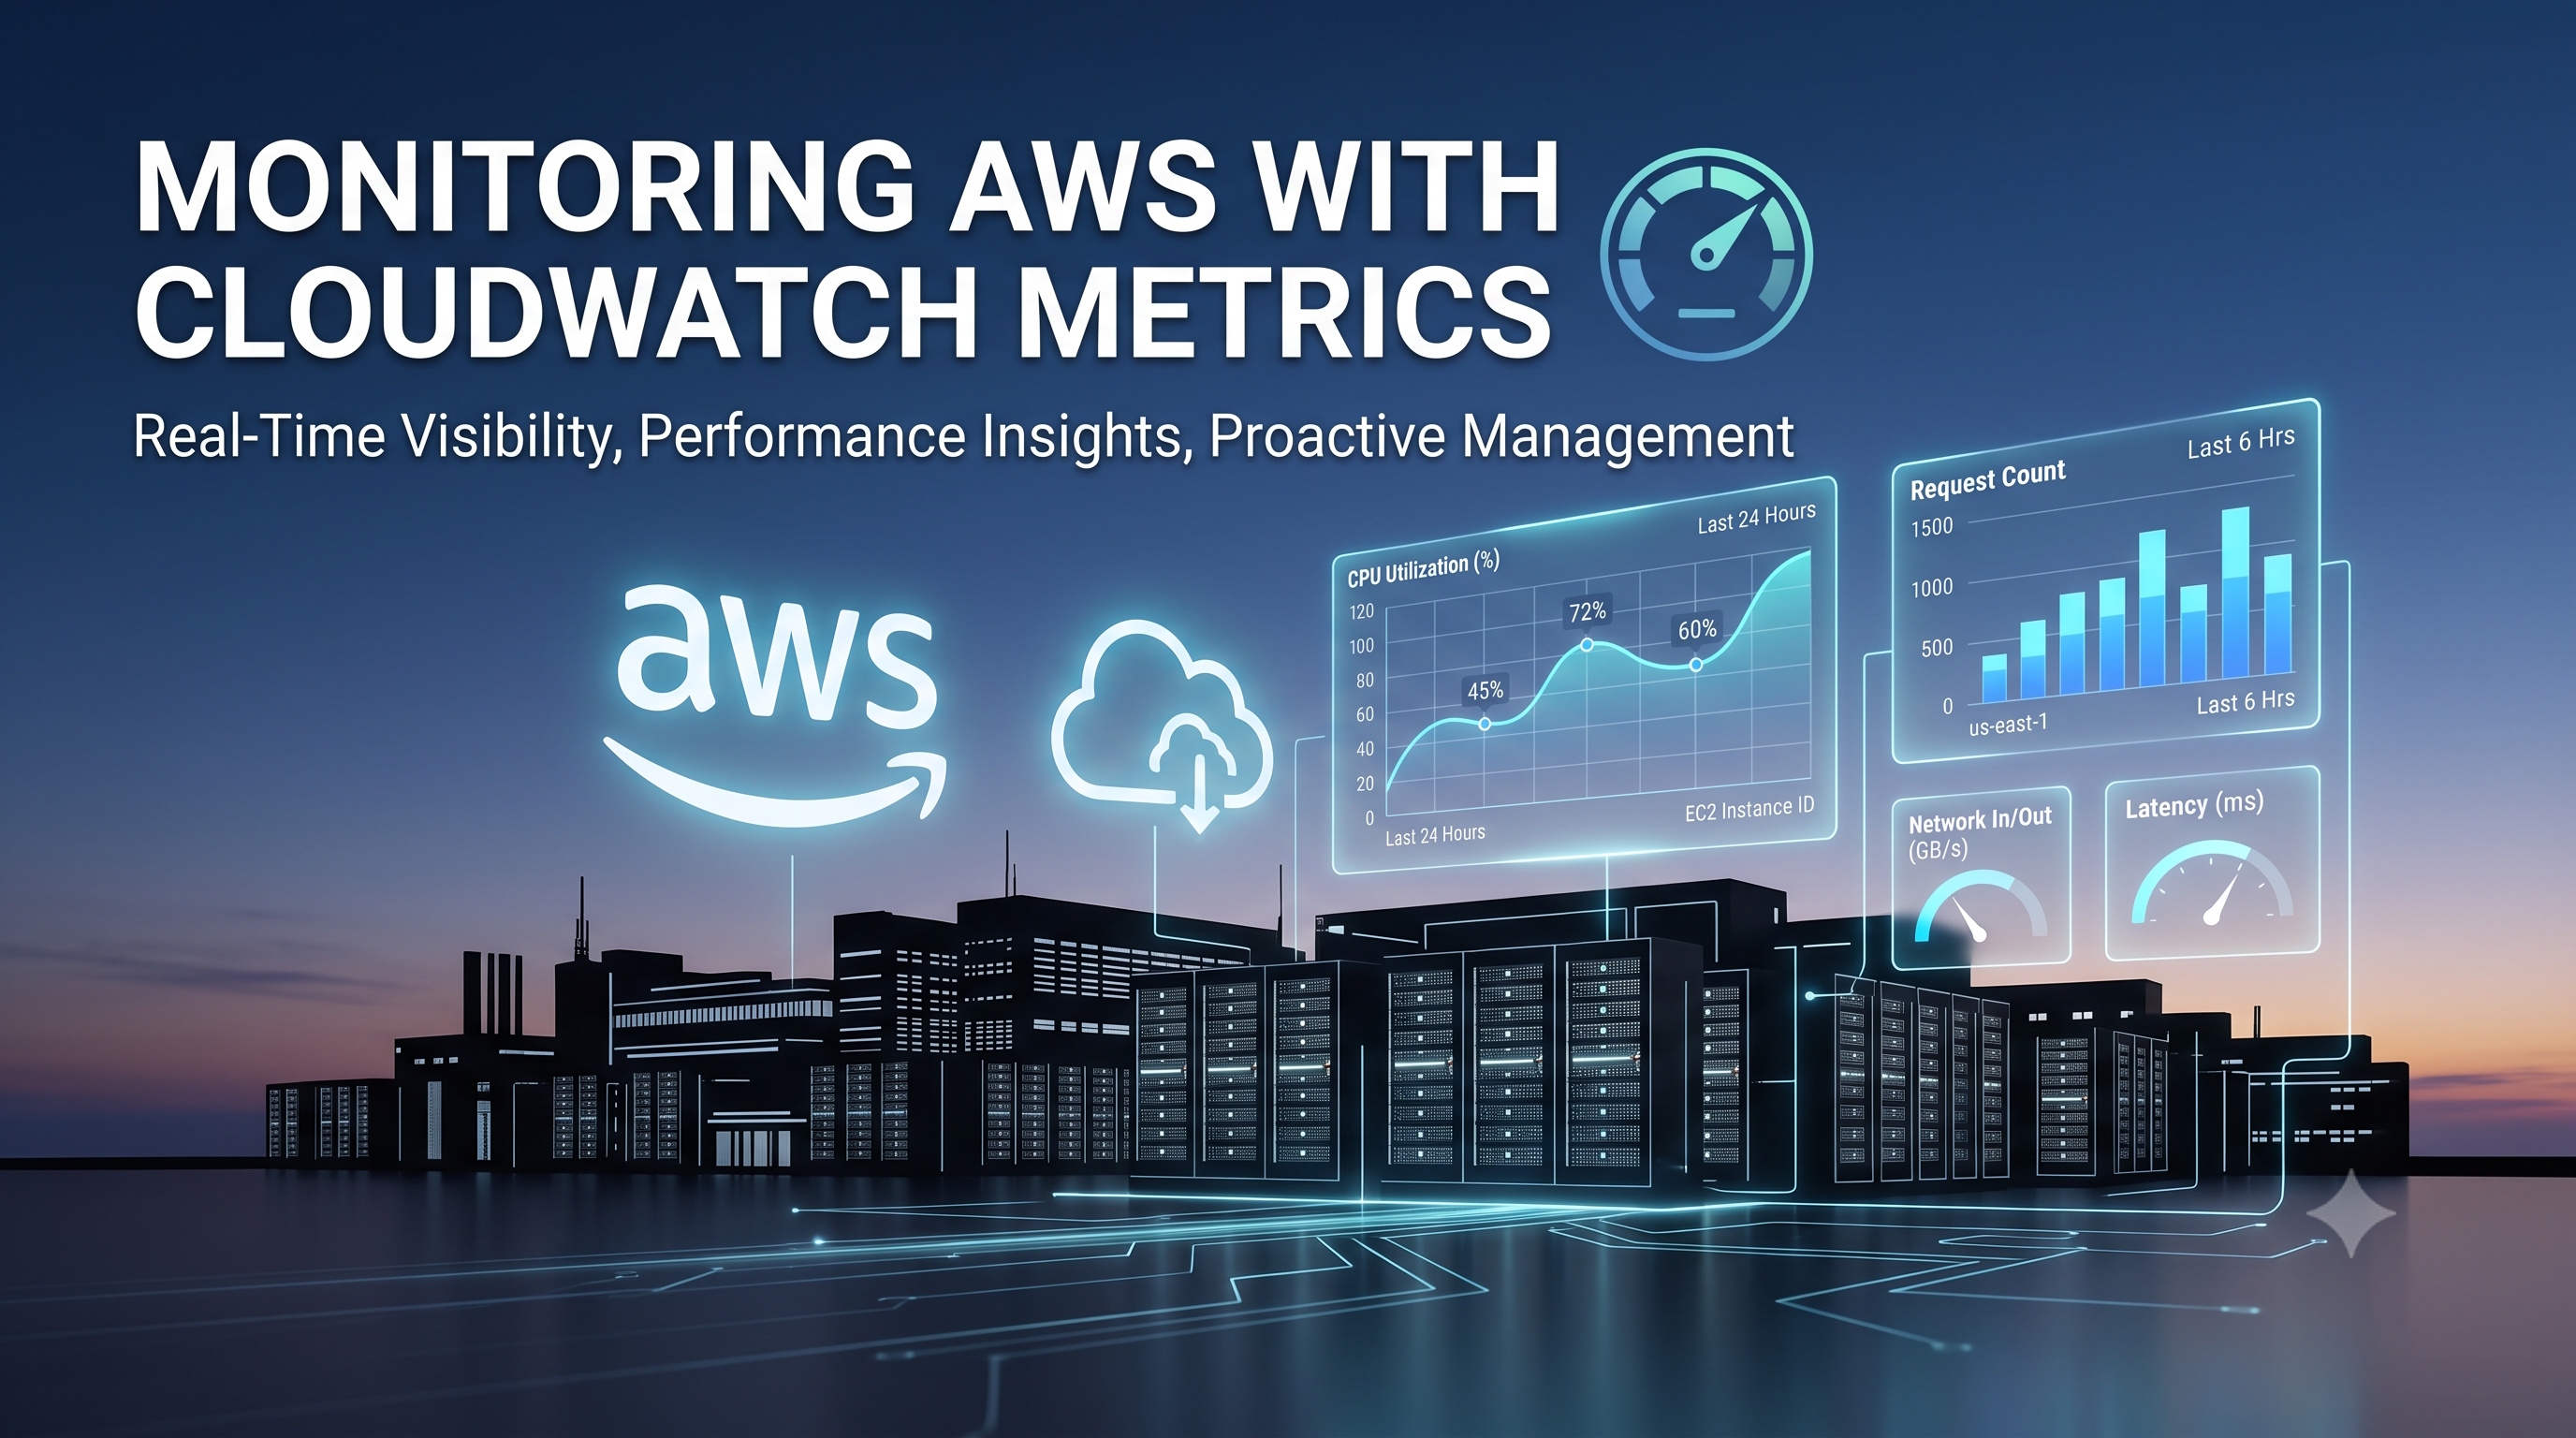
Monitoring with CloudWatch metrics provides a scalable, flexible foundation for maintaining the health and performance of AWS workloads. By understanding metric types, establishing disciplined collection processes, configuring precise alarms, and following best practices, organizations can achieve rapid detection of issues, informed capacity planning, and automated remediation. Integrating CloudWatch with complementary AWS services further amplifies its capabilities, turning raw data into actionable insight. A thoughtful monitoring strategy built on CloudWatch metrics is essential for delivering reliable, cost‑effective cloud solutions.
Introduction
Effective monitoring is a cornerstone of reliable cloud operations. Amazon CloudWatch provides a comprehensive platform for collecting, visualizing, and acting on performance data from AWS resources and custom applications. By leveraging CloudWatch metrics, organizations can detect anomalies, optimize resource usage, and maintain service level agreements. This article explores the core concepts of CloudWatch metrics, guides you through setup and configuration, outlines best practices, and highlights common challenges and real‑world applications.
Understanding CloudWatch Metrics
CloudWatch metrics are time‑stamped data points that represent the state of a system component. Each metric belongs to a namespace, which groups related data, and is identified by a metric name and optional dimensions that provide additional context such as instance ID or availability zone. Metrics are stored with a default resolution of one minute, but high‑resolution metrics can be published at one‑second intervals for latency‑sensitive workloads.
Types of Metrics
- AWS‑provided metrics – automatically generated for most AWS services (for example, CPUUtilization for EC2, ReadLatency for RDS).
- Custom metrics – published by applications or on‑premises systems using the PutMetricData API.
- High‑resolution metrics – support one‑second granularity, useful for real‑time monitoring of critical paths.
- Derived metrics – created from existing data using CloudWatch Metric Math to calculate ratios, percentages, or other composite values.
Setting Up Metric Collection
Collecting meaningful metrics begins with identifying the key performance indicators (KPIs) for each workload. The following steps outline a typical setup process.
Step‑by‑Step Configuration
1. Enable detailed monitoring for services that support it (for example, EC2 instances) to obtain one‑minute granularity without additional cost.
2. Install the CloudWatch Agent on servers that require custom or system‑level metrics such as memory usage, disk I/O, and network traffic.
3. Define metric namespaces and dimensions in the agent configuration file to ensure consistent naming and easy filtering.
4. Publish custom metrics using the AWS SDK, CLI, or CloudWatch Agent’s `metrics` section for application‑specific data.
5. Verify ingestion by navigating to the CloudWatch console, selecting the appropriate namespace, and confirming that data points appear as expected.
Configuring Alarms
Alarms translate metric data into actionable alerts. Proper alarm design reduces noise and improves response times.
- Select a metric that directly reflects the health of the target resource.
- Choose an appropriate statistic (Average, Sum, Minimum, Maximum, or SampleCount) based on the metric’s nature.
- Define a threshold that represents a breach of acceptable performance.
- Set evaluation periods to balance sensitivity and stability; multiple consecutive periods help avoid false positives.
- Specify notification actions such as SNS topics, Auto Scaling policies, or Lambda functions to automate remediation.
Best Practices for Effective Monitoring
Adhering to proven practices maximizes the value of CloudWatch metrics and minimizes operational overhead.
- Standardize naming conventions for namespaces, metric names, and dimensions to simplify cross‑team collaboration.
- Leverage Metric Math to create composite indicators that reflect business outcomes, such as error‑rate percentages or request‑per‑second ratios.
- Implement tag‑driven dashboards that automatically surface resources based on AWS tags, ensuring visibility as the environment scales.
- Use anomaly detection to let CloudWatch learn normal patterns and trigger alerts only when deviations exceed statistical confidence bounds.
- Archive raw metric data to Amazon S3 via CloudWatch metric streams for long‑term analysis and compliance reporting.
- Review alarm configurations regularly to adjust thresholds as workloads evolve and to retire obsolete alerts.
Common Pitfalls and How to Avoid Them
Even experienced teams encounter challenges when implementing monitoring solutions. Recognizing these pitfalls early can prevent costly incidents.
- Over‑monitoring – publishing excessive custom metrics leads to higher costs and noisy dashboards. Focus on metrics that drive decisions.
- Inconsistent dimensions – using different dimension keys for the same logical entity makes aggregation difficult. Define a dimension schema and enforce it through automation.
- Static thresholds – hard‑coded limits fail to adapt to traffic spikes or seasonal variations. Combine static thresholds with anomaly detection where appropriate.
- Delayed alarm actions – setting evaluation periods that are too long postpones remediation. Align period length with the criticality of the metric.
- Neglecting high‑resolution metrics – for latency‑sensitive services, default one‑minute granularity may hide short‑lived spikes. Enable high‑resolution publishing when needed.
Integrating CloudWatch with Other AWS Services
CloudWatch serves as a central hub for observability, and its integration capabilities extend its usefulness across the AWS ecosystem.
- AWS Lambda can process metric streams in real time, enriching data with additional context before storage.
- AWS Systems Manager can retrieve metric data to inform automation runbooks.
- AWS EventBridge can route metric‑based events to third‑party incident management platforms.
- AWS Cost Explorer can correlate metric usage with cost data, helping teams optimize spend.
Real‑World Use Cases
- Auto Scaling based on CPU and request latency – EC2 Auto Scaling groups adjust capacity by evaluating CloudWatch alarms that monitor CPUUtilization and custom latency metrics.
- Database health monitoring – RDS instances publish read/write latency, free storage space, and replica lag, enabling proactive scaling or failover.
- Microservice observability – Each service publishes request count, error count, and duration metrics; Metric Math calculates error‑rate percentages displayed on a unified dashboard.
- Security compliance – CloudWatch logs capture API call activity; metric filters count unauthorized access attempts and trigger alerts to security teams.
Conclusion
Monitoring with CloudWatch metrics provides a scalable, flexible foundation for maintaining the health and performance of AWS workloads. By understanding metric types, establishing disciplined collection processes, configuring precise alarms, and following best practices, organizations can achieve rapid detection of issues, informed capacity planning, and automated remediation. Integrating CloudWatch with complementary AWS services further amplifies its capabilities, turning raw data into actionable insight. A thoughtful monitoring strategy built on CloudWatch metrics is essential for delivering reliable, cost‑effective cloud solutions.